 普罗米修斯安装
# 1.下载
# 2.解压
[root@localhost prometheus]# ll
total 62792
-rw-r--r-- 1 root root 64298432 Dec  1 00:17 prometheus-2.23.0.linux-amd64 (1).tar.gz
[root@localhost prometheus]# tar xvfz prometheus-*.tar.gz
prometheus-2.23.0.linux-amd64/
prometheus-2.23.0.linux-amd64/LICENSE
prometheus-2.23.0.linux-amd64/consoles/
prometheus-2.23.0.linux-amd64/consoles/node-cpu.html
prometheus-2.23.0.linux-amd64/consoles/prometheus-overview.html
prometheus-2.23.0.linux-amd64/consoles/node-overview.html
prometheus-2.23.0.linux-amd64/consoles/node.html
prometheus-2.23.0.linux-amd64/consoles/node-disk.html
prometheus-2.23.0.linux-amd64/consoles/index.html.example
prometheus-2.23.0.linux-amd64/consoles/prometheus.html
prometheus-2.23.0.linux-amd64/prometheus
prometheus-2.23.0.linux-amd64/console_libraries/
prometheus-2.23.0.linux-amd64/console_libraries/prom.lib
prometheus-2.23.0.linux-amd64/console_libraries/menu.lib
prometheus-2.23.0.linux-amd64/prometheus.yml
prometheus-2.23.0.linux-amd64/promtool
prometheus-2.23.0.linux-amd64/NOTICE
[root@localhost prometheus]#
1
2
3
4
5
6
7
8
9
10
11
12
13
14
15
16
17
18
19
20
21
22
2
3
4
5
6
7
8
9
10
11
12
13
14
15
16
17
18
19
20
21
22
# 3.启动
[root@localhost prometheus-2.23.0.linux-amd64]# cat prometheus.yml
# my global config
global:
  scrape_interval:     15s # Set the scrape interval to every 15 seconds. Default is every 1 minute.
  evaluation_interval: 15s # Evaluate rules every 15 seconds. The default is every 1 minute.
  # scrape_timeout is set to the global default (10s).

# Alertmanager configuration
alerting:
  alertmanagers:
  - static_configs:
    - targets:
      # - alertmanager:9093

# Load rules once and periodically evaluate them according to the global 'evaluation_interval'.
rule_files:
  # - "first_rules.yml"
  # - "second_rules.yml"

# A scrape configuration containing exactly one endpoint to scrape:
# Here it's Prometheus itself.
scrape_configs:
  # The job name is added as a label `job=<job_name>` to any timeseries scraped from this config.
  - job_name: 'prometheus'

    # metrics_path defaults to '/metrics'
    # scheme defaults to 'http'.

    static_configs:
    - targets: ['localhost:9090']
[root@localhost prometheus-2.23.0.linux-amd64]# ll
total 162452
drwxr-xr-x 2 3434 3434       38 Nov 26 20:47 console_libraries
drwxr-xr-x 2 3434 3434      173 Nov 26 20:47 consoles
-rw-r--r-- 1 3434 3434    11357 Nov 26 20:47 LICENSE
-rw-r--r-- 1 3434 3434     3420 Nov 26 20:47 NOTICE
-rwxr-xr-x 1 3434 3434 88153522 Nov 26 18:58 prometheus
-rw-r--r-- 1 3434 3434      926 Nov 26 20:47 prometheus.yml
-rwxr-xr-x 1 3434 3434 78172790 Nov 26 19:00 promtool
[root@localhost prometheus-2.23.0.linux-amd64]# ./prometheus --config.file=prometheus.yml
1
2
3
4
5
6
7
8
9
10
11
12
13
14
15
16
17
18
19
20
21
22
23
24
25
26
27
28
29
30
31
32
33
34
35
36
37
38
39
40
2
3
4
5
6
7
8
9
10
11
12
13
14
15
16
17
18
19
20
21
22
23
24
25
26
27
28
29
30
31
32
33
34
35
36
37
38
39
40
# 5.验证
此时登录系统ip:9090
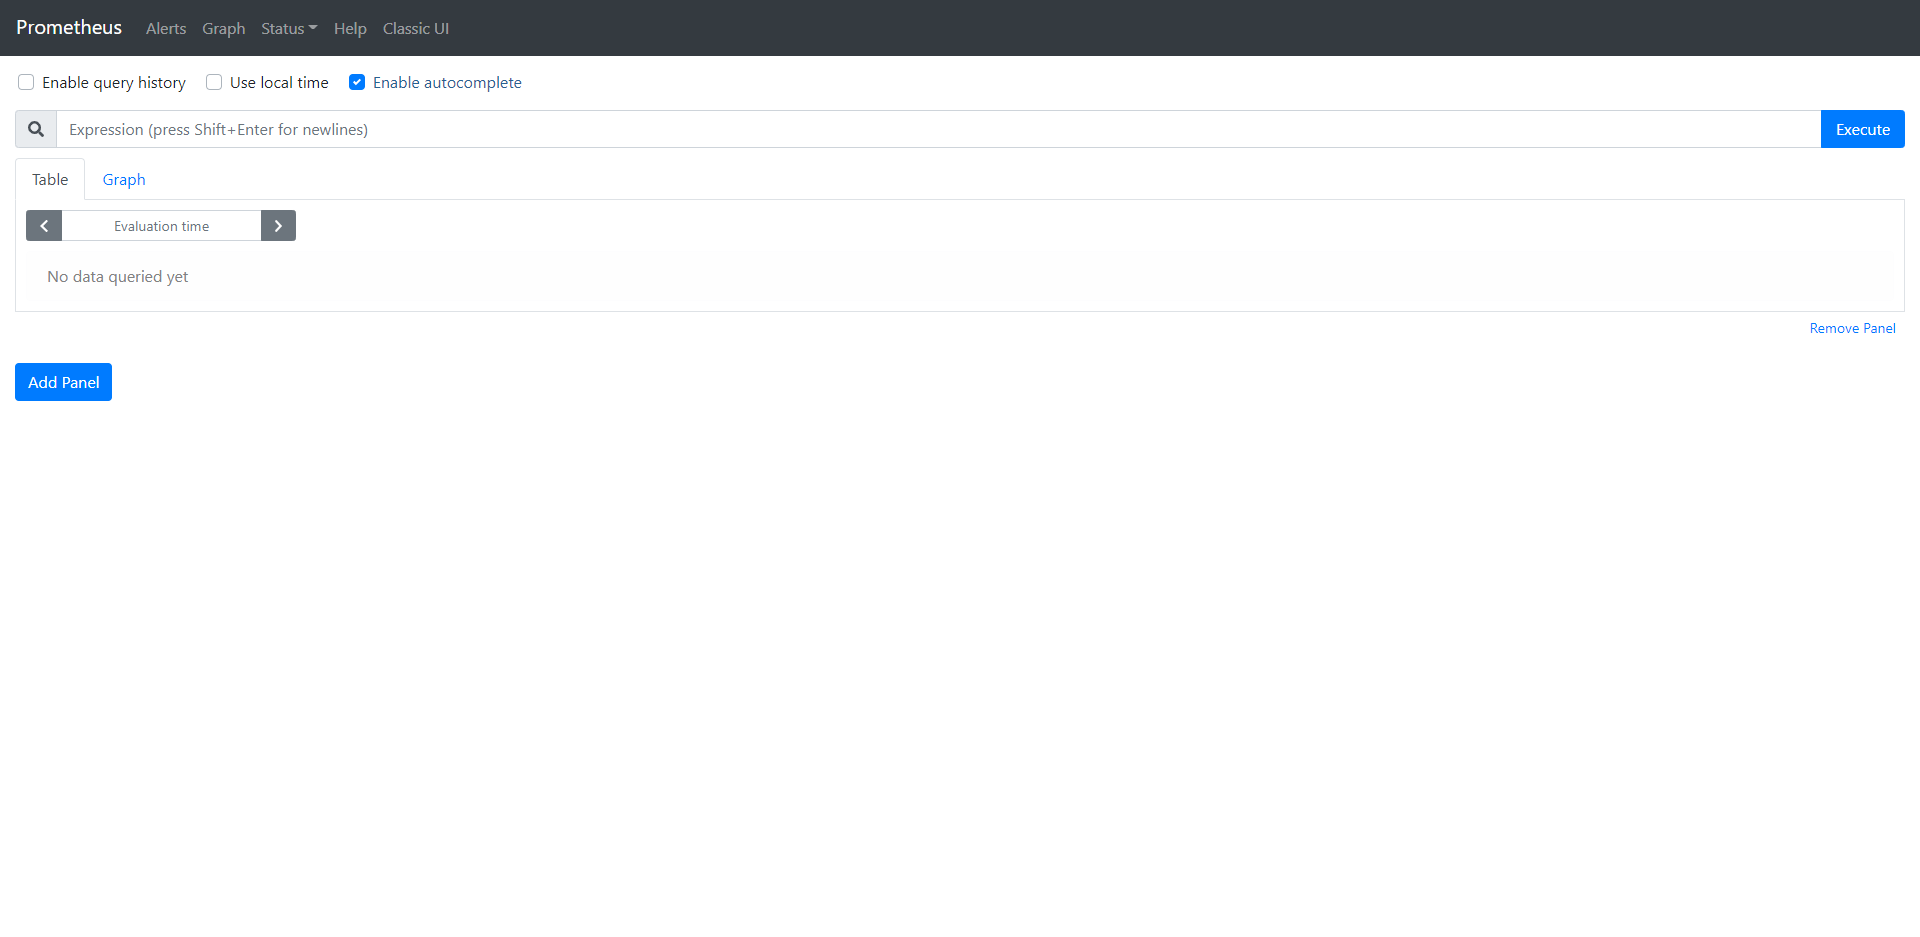
此时登录系统ip:9090/metrics可以查看到监控的数据